Intelligence Centre
Executive Command Centre
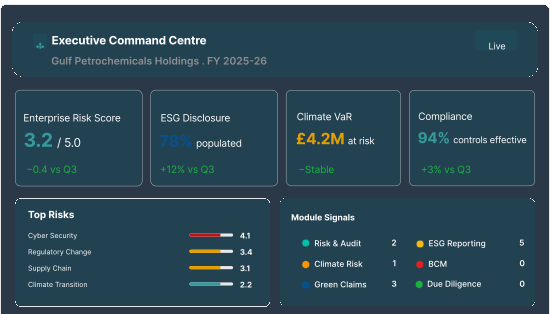
One screen. Every signal. The consolidated intelligence layer that connects risk, compliance, sustainability, and climate into a single decision surface — with native dashboards, Power BI integration, and board-ready exports built in.
The Problem With Fragmented Oversight
Enterprise leadership teams manage risk in one system, ESG in another, climate in a spreadsheet, and compliance in email. When your board asks what is our exposure?, assembling the answer takes weeks — and it's already outdated.






3–4 weeks
Average time to compile a cross-functional board risk report manually.
Blind spots
Siloed modules miss correlations between climate, compliance, and operational risk.
Stale by arrival
By the time data reaches the board table, the risk landscape has already shifted.
What the Command Centre Delivers
Not another dashboard builder. A decision intelligence layer purpose-built for executive oversight.

Native Dashboard Engine
Purpose-built, domain-aware dashboards — risk heatmaps, ESG scorecards, compliance gauges, climate scenario charts. Configurable widgets, drag-and-drop layouts, and real-time refresh from every module.
No manual aggregation. No stale spreadsheets.

Cross-Module Signals
The Command Centre surfaces correlations that siloed modules miss. A climate risk spike triggering supply chain alerts. A compliance gap linked to an open audit finding.
Connected intelligence, not just dashboards.

Escalation & Alerting
Configurable thresholds that escalate signals when they breach appetite levels. Board-level alerts for critical movements. No noise — only what demands attention.
Risk appetite integration with automatic escalation.

Board-Ready Reporting
One-click export of executive summaries, risk heatmaps, and compliance dashboards to PDF, PPTX, or directly into Power BI. Formatted for board packs, audit committees, and regulatory submissions.
From live data to board table in minutes.

Drill-Down Navigation
Every metric is clickable. Drill from a portfolio-level KPI down to the individual control, metric, or evidence record that drives it. Full traceability at every layer.
Surface-level clarity with depth on demand.

Role-Based Views
CFOs see financial exposure. CROs see risk trajectories. Heads of Compliance see control effectiveness. Same data, tailored lenses — all governed by RBAC.
Each executive sees exactly what they need.
One Platform, Every Lens
One Platform, Every Lens Role-based views ensure each executive sees the signals that matter to their mandate — without noise.
Chief Risk Officer

Enterprise risk heatmap
Top 10 risks with trajectory
Control effectiveness rate
Incident trend analysis
Chief Financial Officer
Climate VaR exposure
Taxonomy-aligned revenue %
Carbon cost projections
Financed emissions by portfolio
Head of Compliance
Regulatory change pipeline
Policy attestation rates
Open findings by severity
Framework coverage gaps
Company Secretary
Board evaluation status
Governance action tracker
Meeting schedule & quorum
Disclosure deadlines
Your Data, Your Way
Purpose-built native dashboards for GRC and sustainability — or connect to Power BI for teams already invested in the Microsoft ecosystem. No compromise either way.
Native Dashboards
Included
Pre-configured, domain-aware dashboards designed specifically for governance, risk, compliance, and sustainability workflows. Zero setup required.

Domain-Aware Widgets
Configurable Layouts
Real-Time Refresh
Drill-Through Navigation
Board Pack Export
Threshold Alerts
Power BI Integration
Connector
Already standardised on Power BI? Connect SustainGRC as a live data source. Build custom reports using your existing templates and workflows.
Certified Connector
Live & DirectQuery
Pre-Built Templates
Semantic Model
Row-Level Security
Embedded Reports